
A stretch of State Route 91 between Corona and Riverside roughly fifteen miles long recorded 15 motorcyclist deaths from 2019 through 2023. That works out to 0.96 deaths per mile, close to one for every mile of pavement, and higher than any other major California highway in a five-year analysis of state crash records.
Ortega Highway sits second at 0.52. It also crosses Riverside County.
Ortega has a reputation earned across decades of canyon runs and roadside memorials, and it shows up in every conversation about California’s punishing back roads. SR-91 is a commuter freeway. It carries people to work in Orange County and back again, through some of the heaviest recurring congestion in the state, and by this measure it takes nearly twice the per-mile toll of the canyon road riders worry about.
The underlying figures come from the California Highway Patrol’s Statewide Integrated Traffic Records System, accessed through UC Berkeley’s Transportation Injury Mapping System. Across the five years, the analysis counted 18,923 crashes involving motorcycles, 3,024 people killed, and 3,674 severely injured.
Key Takeaways
- State Route 91 through Riverside leads at 0.96 deaths per mile, with 15 killed along a section of roughly 15 miles between 2019 and 2023.
- Ortega Highway (SR-74) ranks second at 0.52 deaths per mile. The two worst corridors by this measure are both in Riverside County.
- Interstate 10 through Los Angeles County recorded the highest raw total of any single road, at 19 deaths. It is also long, which is why it does not lead the per-mile ranking.
- Merced County has the highest death rate per registered motorcycle at 173.5 per 100,000 annually, against a statewide average of 70.9.
- Los Angeles County ranks 21st by that rate despite recording 632 deaths, more than double any other county’s raw count.
- The 3,024 figure counts everyone killed in a crash involving a motorcycle, including car occupants and pedestrians, not motorcyclists alone. CHP counted 484 motorcyclists killed in 2019 against the study’s 500.
- Riders were at fault in roughly two-thirds of fatal motorcycle crashes, 66.9 percent in 2019 and 65.5 percent in 2020 by CHP’s determination.
- Automobile right-of-way violations rose as a primary crash factor for three straight years, from 16.0 percent of serious motorcycle crashes in 2021 to 19.3 percent in 2023.
Deaths per Mile: The Ranking That Separates Roads From Their Reputations
Ranking highways by total deaths rewards length and traffic volume. Interstate 405 appears near the top of almost any California crash count because it is long, permanently busy, and threads through the densest part of the state. Dividing by distance asks a different question: how much risk sits in each mile a rider covers?
| Corridor | County | Length | Killed | Deaths per mile |
|---|---|---|---|---|
| SR-91 | Riverside | 15 mi | 15 | 0.96 |
| Ortega Highway (SR-74) | Riverside | 21 mi | 11 | 0.52 |
| San Gabriel Canyon Road (SR-39) | Los Angeles | 27 mi | 11 | 0.41 |
| Angeles Crest Highway (SR-2) | Los Angeles | 66 mi | 14 | 0.21 |
| Pacific Coast Highway (SR-1) | Los Angeles | 75 mi | 13 | 0.17 |

Angeles Crest and PCH carry the mythology. Both land at the bottom of this table, and the reason is arithmetic rather than safety. Angeles Crest stretches 66 miles. PCH covers 75 through Los Angeles County alone. Spread a dozen deaths across that much road and the per-mile figure falls, even though the raw counts are comparable to the leaders.
San Gabriel Canyon Road covers 27 miles and recorded 11 deaths across 84 crashes that killed or seriously injured somebody. It draws weekend traffic heading toward the reservoirs above Azusa, mixes sport riders with slow recreational drivers, and offers few places to pass safely.
The Roads With the Highest Raw Totals
Sorted by body count instead, freeways dominate. Nine of the ten worst are urban interstates or major state routes through metropolitan counties.
| Rank | Corridor | County | Killed | Fatal and serious-injury crashes |
|---|---|---|---|---|
| 1 | Interstate 10 | Los Angeles | 19 | 150 |
| 2 | SR-74 (Ortega Highway) | Riverside | 18 | 90 |
| 3 | Pacific Coast Highway (SR-1) | Los Angeles | 15 | 97 |
| 4 | Interstate 5 | Los Angeles | 15 | 112 |
| 5 | SR-91 | Riverside | 15 | 82 |
| 6 | Interstate 5 | San Diego | 15 | 135 |
| 7 | US 101 | Santa Clara | 13 | 67 |
| 8 | Interstate 880 | Alameda | 12 | 121 |
| 9 | Angeles Crest Highway (SR-2) | Los Angeles | 12 | 78 |
| 10 | Interstate 405 | Los Angeles | 12 | 155 |
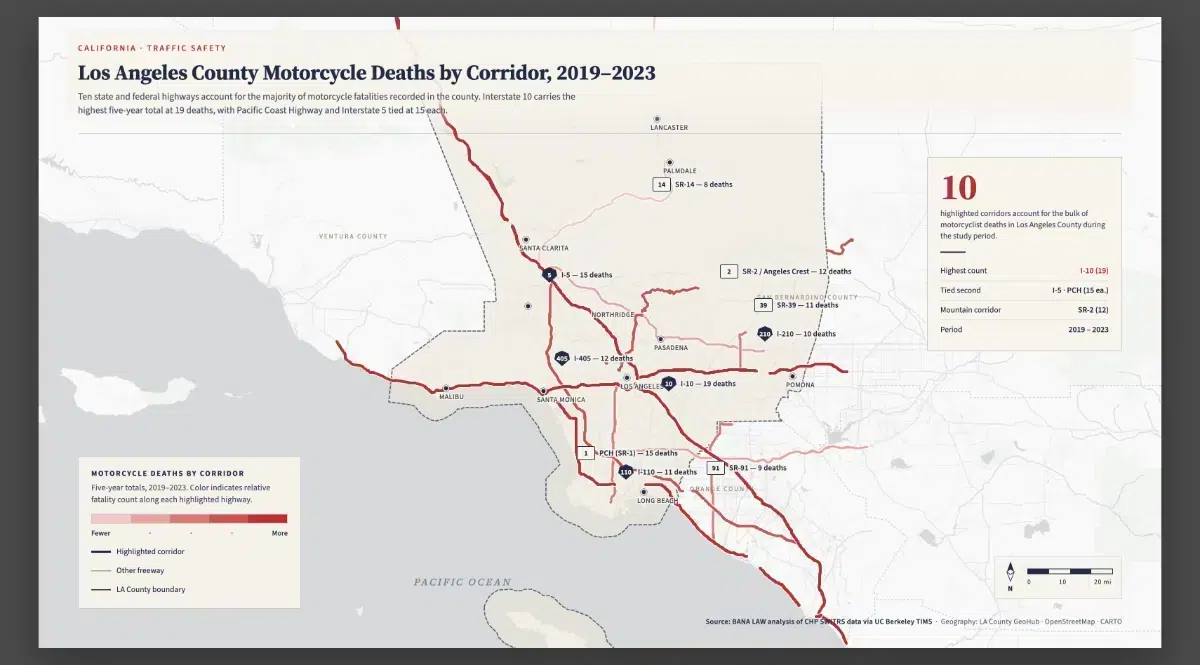
Ortega Highway carries two different numbers across the two rankings, 18 deaths here and 11 in the per-mile table. The source does not explain the gap, and the most plausible reading is that the tables cover different lengths of the same route. SR-74 runs from Interstate 5 in San Juan Capistrano across the Santa Ana Mountains and onward toward Palm Desert, so a 21-mile Riverside County segment captures the canyon section riders mean when they say Ortega, while the full route picks up considerably more. Pacific Coast Highway and Angeles Crest show smaller mismatches of the same kind. Naming that matters more than glossing it, because which table you read changes the number you quote.
SR-91 is the one corridor where both rankings agree.
What the 3,024 Figure Counts
The five-year total describes everyone killed in a crash that involved a motorcycle. A driver who dies in the car, a pedestrian struck during the same sequence, and the rider are all inside that number. It is a legitimate way to measure the harm these crashes cause, and it is not the same as counting motorcyclists.
CHP publishes the narrower figure. For the two years where the same database reports both, the difference is modest and consistent.
| Year | All deaths in motorcycle-involved crashes | Motorcyclists killed | Source for column 3 |
|---|---|---|---|
| 2019 | 500 | 484 | CHP SWITRS |
| 2020 | 580 | 565 | CHP SWITRS |
| 2021 | 647 | 565 | FARS |
| 2022 | 675 | 649 | FARS |
| 2023 | 622 | 583 | FARS |
The first two rows compare like with like. Sixteen of the 500 people killed in 2019 were not on the motorcycle, and 15 of the 580 in 2020. Roughly three percent of the toll falls on people in cars and on foot.
The last three rows mix two effects and should be read with more care. CHP has not published comparable annual summaries for 2021 through 2023, so those motorcyclist counts come from the federal Fatality Analysis Reporting System. FARS and SWITRS collect and define crash records differently, and the two were never meant to form a single series. The 82-death gap in 2021 reflects that methodological split as much as it reflects who was riding.

Either series tells the same story about direction. Deaths climbed hard through 2022 and eased in 2023, the first improvement in the window, from a peak that remained well above where the state started. Nationally the trend moves alongside it. IIHS counted 6,228 motorcyclists killed across the country in 2024, about 23 percent above the 2019 figure.
Why Los Angeles Ranks 21st
Los Angeles County recorded 632 deaths across the five years, more than San Bernardino and San Diego combined. Measured against registered motorcycles, it drops to 21st.
| Rank | County | Deaths per 100,000 registered motorcycles | Against the statewide average of 70.9 |
|---|---|---|---|
| 1 | Merced | 173.5 | 2.4 times |
| 2 | Kern | 145.4 | 2.1 times |
| 3 | Yuba | 144.7 | 2.0 times |
| 4 | Lassen | 139.7 | 2.0 times |
| 5 | Tulare | 124.3 | 1.8 times |
| 6 | Madera | 123.4 | 1.7 times |
| 7 | Tuolumne | 118.8 | 1.7 times |
| 8 | San Bernardino | 118.7 | 1.7 times |
| 9 | Fresno | 108.9 | 1.5 times |
| 10 | Butte | 104.5 | 1.5 times |
Every county in that top ten sits inland, and seven of them are in the Central Valley or the Sierra foothills. The clustering is real, but the metric behind it needs qualifying before anyone reads it as a map of where riding is most hazardous.
Registered motorcycles are a proxy for exposure, and a rough one. A bike registered in Merced covers different ground than a bike registered in Santa Monica: longer trips, higher posted limits, undivided two-lane highways, fewer signals, and much longer waits for an ambulance once something goes wrong. Rural crashes are more lethal partly because rural medicine is farther away. The rate is measuring miles and geography alongside behavior.
Small denominators add noise on top of that. Lassen County registers a few thousand motorcycles. A handful of deaths in a five-year window moves its rate enormously, which places it fourth on a base too thin to carry that much weight. Merced, Kern, and Tulare rest on larger populations and hold up better.
The denominator also comes from a single year. The analysis divides five years of deaths by 2019 registration counts, and registrations did not hold still through 2023.
The Part That Concerns Drivers
Motorcycle safety coverage tends to address riders. The crash records also describe what the car drivers were doing.
CHP found riders at fault in 66.9 percent of fatal motorcycle crashes in 2019 and 65.5 percent in 2020. Solo crashes with no other party involved accounted for 28.1 percent of the 2019 total and 31.7 percent in 2020, and in those the rider was assigned fault about 95 percent of the time. Two out of three times, the motorcyclist made the decisive error.
The remaining third is where drivers live, and its composition has been shifting.
| Primary crash factor | 2021 | 2022 | 2023 |
|---|---|---|---|
| Unsafe speed | 29.1% | 28.7% | 28.2% |
| Improper turning | 21.9% | 21.3% | 19.8% |
| Automobile right of way | 16.0% | 17.2% | 19.3% |
| Driving under the influence | 10.1% | 9.6% | — |
| Unsafe lane change | 5.5% | 5.4% | — |
Automobile right-of-way violations climbed in each of the three years while every other listed factor fell. By 2023 they were the primary cause in nearly one of every five serious motorcycle crashes in the state. The category describes a car driver who failed to yield when a motorcycle had the right to proceed.
Crash type points at the same moment. Broadside collisions made up 31.1 percent of serious motorcycle crashes in 2023, the largest single category, ahead of overturning at 15.9 percent and hitting a fixed object at 15.5 percent. A broadside impact involving a bike is usually a car crossing or turning across its path at an intersection, which is the classic left-turn-across-traffic failure. The driver looks, registers no car, and goes.
Look twice at intersections and while turning left, particularly into a low sun or past an A-pillar wide enough to hide an approaching bike. Check the mirror and the blind spot before changing lanes, because California legalized lane splitting in 2016 under AB 51 and the CHP publishes speed guidance for riders who do it. A motorcycle may lawfully occupy the space between lanes that a driver’s mental model treats as empty.
Consequences are not symmetrical in these crashes. Per mile traveled, motorcyclists die at roughly 28 times the rate of people in cars. The same misjudgment that produces a scraped bumper between two sedans kills somebody on a bike.
Where the Risk Concentrates
Two patterns emerge from the corridor and county data taken together.
Urban freeways generate volume. Interstate 10, Interstate 5, Interstate 405, and Interstate 880 accumulate deaths because millions of vehicles use them and a fraction of those trips end badly. Riders cannot avoid these roads and would not want to; they are how people get to work.
Rural and canyon roads generate rate. Merced, Kern, Tulare, and Madera post the worst per-registration figures. SR-91’s 15-mile section and Ortega’s mountain crossing concentrate deaths into short distances. Speed differentials are larger, shoulders are narrower, oncoming traffic is separated by paint rather than concrete, and help is farther away.
The men most often killed are between 25 and 34. That group accounted for 22.0 percent of California motorcyclist fatalities in 2023.
Verdict
Riverside County holds the two worst corridors in the state by deaths per mile, and one of them is a commuter freeway rather than a canyon road. SR-91’s 0.96 deaths per mile across a 15-mile section is the number to take from this analysis, because the ranking that produced it is internally consistent in a way the others are not.
Treat the county per-capita table as a starting point rather than a verdict. Dividing five years of deaths by one year of registrations measures rural riding patterns and emergency response times alongside actual risk, and the small-population counties near the top rest on bases too thin to support their ranking.
For drivers, one line in the record matters more than the maps. Automobile right-of-way violations grew from 16.0 to 19.3 percent of serious motorcycle crashes between 2021 and 2023 while every other primary factor declined, and broadside impacts remain the most common crash type. The intersection left turn is where drivers kill motorcyclists, and it is the one thing on this list fully within their control.
Frequently Asked Questions
What is the most dangerous road in California for motorcyclists?
By deaths per mile, State Route 91 through Riverside County. A 15-mile section recorded 15 motorcyclist deaths between 2019 and 2023, a rate of 0.96 per mile. By raw total, Interstate 10 through Los Angeles County leads with 19 deaths across the same period.
What is the deadliest highway in California overall?
Interstate 10 through Los Angeles County recorded the highest single-road total in the analysis at 19 motorcyclist deaths, along with 150 crashes that killed or severely injured someone. It ranks lower per mile because of its length.
Is Ortega Highway as dangerous as its reputation suggests?
Yes, though it ranks second rather than first. SR-74 recorded 11 deaths across a 21-mile Riverside County section, a rate of 0.52 per mile. The analysis lists 18 deaths for the full route in its total-deaths ranking, which covers considerably more of SR-74 than the canyon segment.
Which California county has the most motorcycle deaths?
Los Angeles County, with 632 deaths from 2019 through 2023. San Bernardino follows at 266, San Diego at 249, and Riverside at 245.
Which county has the highest motorcycle death rate?
Merced County, at 173.5 deaths per 100,000 registered motorcycles annually, roughly 2.4 times the statewide average of 70.9. Kern, Yuba, Lassen, and Tulare complete the top five. All are inland counties.
Why does Los Angeles County rank only 21st by rate?
Los Angeles registers far more motorcycles than any other county, so its large raw total spreads across a large denominator. The comparison also has limits: registered motorcycles approximate exposure rather than measuring miles ridden, and urban trips differ from rural ones in length, speed, and how quickly emergency care arrives.
How many motorcyclists die in California each year?
Between roughly 480 and 650 depending on the year and the counting system. CHP recorded 484 motorcyclists killed in 2019 and 565 in 2020. Federal FARS data put the figure at 565 in 2021, 649 in 2022, and 583 in 2023.
Are California motorcycle deaths rising or falling?
They rose steadily from 2019 through 2022, then fell in 2023 for the first time in the period. The 2023 total remained above where the state started in 2019. National figures moved the same direction, with 6,228 motorcyclists killed across the country in 2024, about 23 percent above 2019.
Who is usually at fault in fatal motorcycle crashes?
The rider, in about two-thirds of cases. CHP assigned fault to motorcyclists in 66.9 percent of fatal crashes in 2019 and 65.5 percent in 2020. Roughly 30 percent of fatal motorcycle crashes involve no other vehicle at all, and riders are found at fault in about 95 percent of those.
What is the most common type of fatal motorcycle crash?
Broadside collisions, at 31.1 percent of California’s serious motorcycle crashes in 2023. Overturning follows at 15.9 percent and striking a fixed object at 15.5 percent. Broadside impacts typically occur when a vehicle crosses or turns across a motorcycle’s path at an intersection.
Is lane splitting legal in California?
Yes. California legalized the practice in 2016 under AB 51, and the CHP publishes guidance on safe speeds for it. Several other states have since permitted low-speed lane filtering, which is narrower in scope. Drivers should check mirrors and blind spots before changing lanes in slow traffic.
Does California require motorcycle helmets?
Yes, for all riders and passengers regardless of age. Helmets reduce the risk of death in a crash by 37 to 42 percent, and unhelmeted riders are about three times more likely to sustain a traumatic brain injury.
Sources and Method
Corridor and county figures come from a Bana Law analysis of CHP SWITRS records accessed through UC Berkeley’s Transportation Injury Mapping System, covering 2019 through 2023, with registration counts from the California DMV. Motorcyclist-only fatality counts for 2019 and 2020 are from CHP’s annual crash summaries; 2021 through 2023 are from NHTSA’s Fatality Analysis Reporting System as reported by UC Berkeley SafeTREC and the California Office of Traffic Safety. Primary crash factors and crash types are SafeTREC figures drawn from provisional SWITRS data. National context is from IIHS. SWITRS and FARS define and collect crash records differently and are labeled separately above rather than combined.

Matthew Wilde
Matthew Wilde is an automotive journalist with experience contributing to leading publications. He focuses on delivering clear, well-researched analysis of automotive industry news and vehicles. Growing up surrounded by a variety of cars, Matthew developed a strong foundation in automotive technology and design. His work emphasizes accuracy and depth, aimed at informing both enthusiasts and industry professionals with straightforward, precise reporting.
https://theweeklydriver.com/