
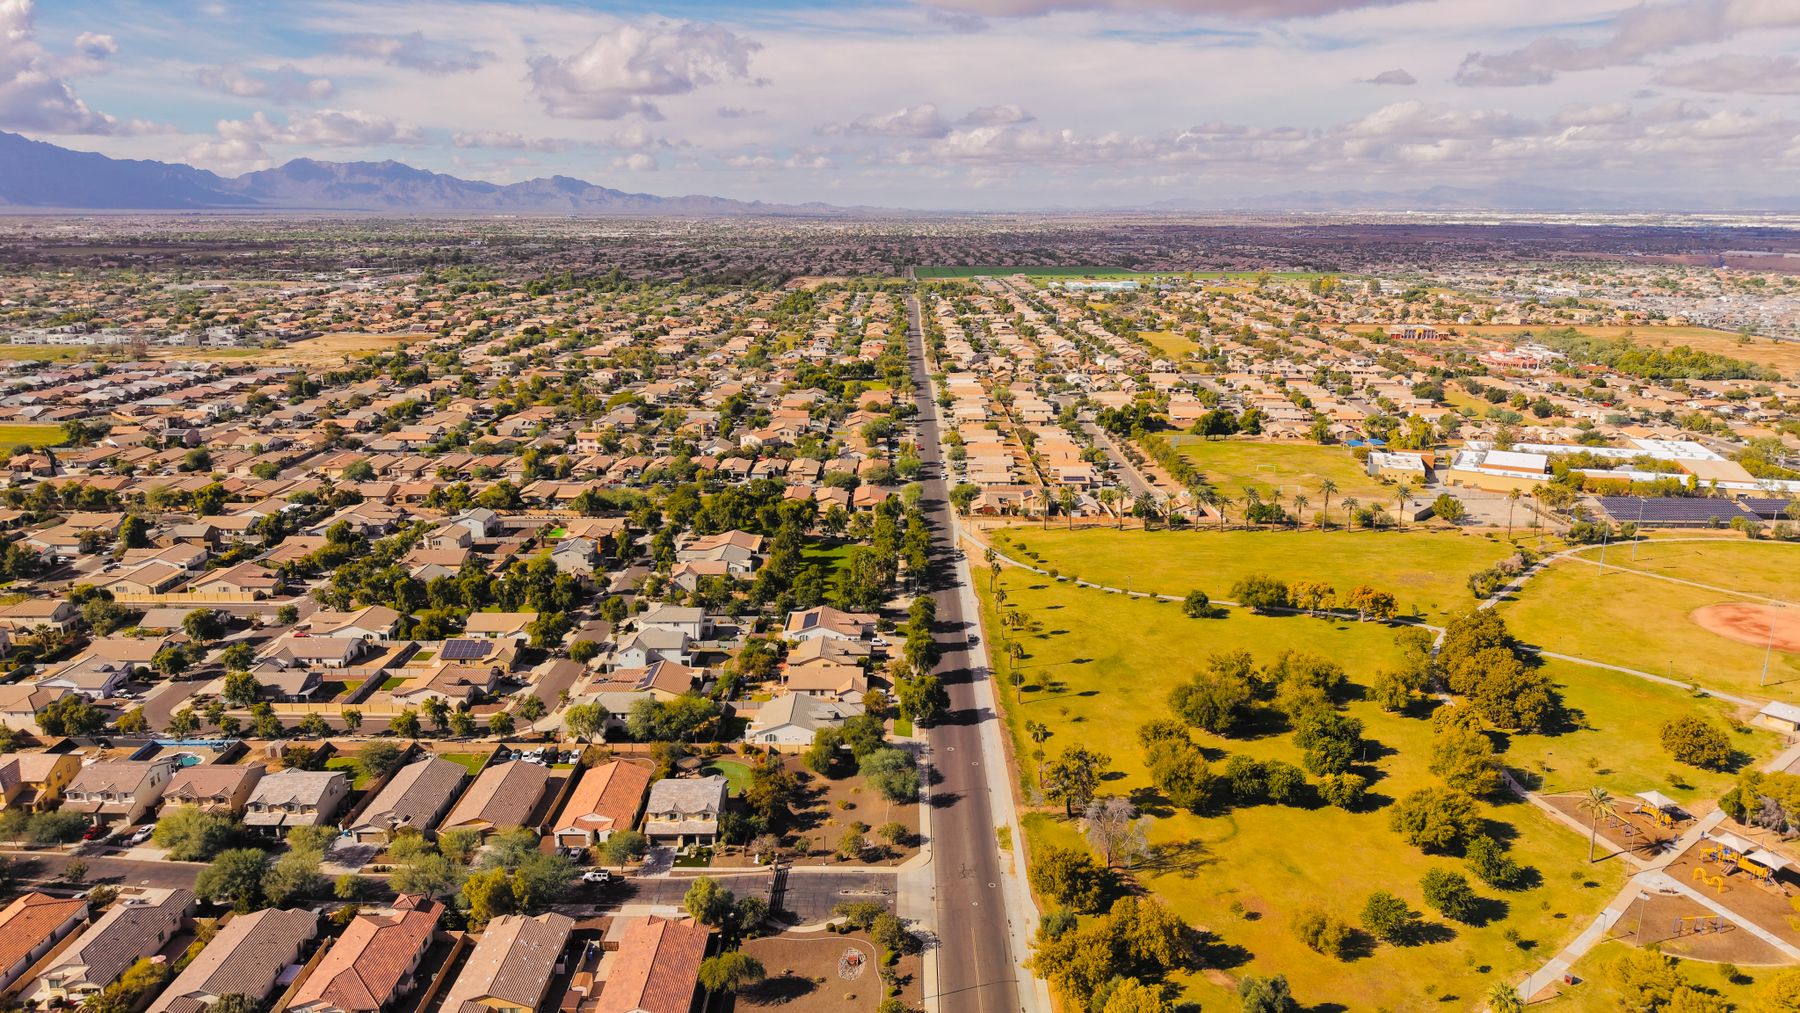
Surprise logged 2,110 traffic crashes in 2024, and 10 people died in them. Goodyear logged 241 fewer and lost 14.
One crash in every 211 killed someone in Surprise. In Goodyear the figure was one in 134.
Both counts come out of the Arizona Department of Transportation’s 2024 Motor Vehicle Crash Facts, the annual tally ADOT assembles from every reportable collision in the state.
Statewide the report records 121,107 crashes and 1,228 deaths. Maricopa County supplied 88,094 of those crashes, 72.74 percent of the state total, along with 594 of the deaths.
The West Valley has spent a decade adding people faster than almost anywhere in the country. The Census Bureau ranked Buckeye the fourth-fastest-growing city in the United States for the year ending July 2021, at 8.6 percent, an increase of 8,001 residents that pushed the city past 100,000 for the first time. Goodyear grew 5.4 percent over the same twelve months. Buckeye had counted 91,502 people in the 2020 census, on a footprint of roughly 640 square miles that was farmland and creosote within living memory.
Crashes tracked the rooftops. Goodyear recorded 1,710 crashes in 2023 and 1,869 in 2024, a 9.3 percent rise in a year when the statewide count fell 1.7 percent. Buckeye’s injury count climbed from 451 to 572 over the same span, up 26.8 percent.
Five West Valley cities appear in the jurisdiction tables. Sort them by how often a crash turned fatal and they separate into two groups. Goodyear and Buckeye lost a person in roughly one collision out of 135. Surprise and Avondale ran nearer one in 210. The county average was one in 148, which leaves Goodyear and Buckeye on the wrong side of it and the other two clear by a wide margin.
Those two cities are also the two whose street networks empty onto Interstate 10 and State Route 85.
Key Takeaways
- Goodyear recorded 14 traffic deaths in 2024, more than any other West Valley city in the ADOT report, on the second-lowest crash count of the five.
- Goodyear and Buckeye are the only two of the five where a crash was likelier to be fatal than the Maricopa County average of one death per 148 crashes.
- Across 2023 and 2024 combined, Goodyear is the only one still on the wrong side of that line, at one death per 108 crashes against the county’s one per 138.
- Goodyear’s crashes rose 9.3 percent between 2023 and 2024 while the statewide count fell 1.7 percent. Buckeye’s injuries climbed 26.8 percent.
- A Buckeye crash injured someone 59 times per 100, against 40 per 100 in Avondale, so the severity gap shows up in the injury column before anyone reaches the fatality column.
- I-10 volume more than triples across the West Valley, from 72,708 vehicles a day at the SR-85 junction to 243,375 at Dysart Road in Goodyear, per ADOT’s 2024 traffic counts.
- Between 21 and 32 percent of everything on SR-85 is a truck. On I-10’s busiest Goodyear segment the truck share is 13 percent.
- Rural crashes killed someone once every 35 times statewide; urban crashes once every 135. West Valley corridors are moving from the first category toward the second.
- Crashes peak in the 3 p.m. hour. Fatal crashes peak in the 6 p.m. hour, which is also the peak hour for pedestrian collisions.
- Arizona gives you two years to file most injury suits, but only one year against a public entity, plus a 180-day notice of claim that runs first.
The Five Cities, by the Numbers
ADOT reports each incorporated city as its own jurisdiction. The final column below is not in the report; it divides crashes by deaths to show how often a collision in each city ended in a fatality.
| Jurisdiction | Crashes | Injured | Killed | Crashes per death |
|---|---|---|---|---|
| Surprise | 2,110 | 856 | 10 | 211 |
| Goodyear | 1,869 | 862 | 14 | 134 |
| Avondale | 1,850 | 745 | 9 | 206 |
| Buckeye | 970 | 572 | 7 | 139 |
| Litchfield Park | 40 | 14 | 1 | 40 |
| Maricopa County (all) | 88,094 | 37,649 | 594 | 148 |
| Arizona (all) | 121,107 | 54,426 | 1,228 | 99 |

Litchfield Park produces the harshest ratio on the page and it means nothing. Forty crashes is too small a sample to carry a rate, and a single death moves it from best to worst.
The other four cities each logged enough volume to be compared against one another.
Goodyear and Surprise are the cleanest pair. They are similar in size, similar in age, and 241 crashes apart. Goodyear injured six more people on 241 fewer collisions and killed four more.
Buckeye separates from the group on injuries too. The city recorded 572 injuries across 970 crashes, 59 per hundred. Avondale recorded 745 across 1,850, or 40 per hundred.
A Buckeye collision put somebody in an ambulance about half again as often as an Avondale one, and that gap sits underneath the fatality gap rather than beside it.
What 2023 Adds
One year is a thin basis for a claim about a road network, so the 2023 edition of the same report is worth running alongside it.
Goodyear recorded 19 deaths on 1,710 crashes in 2023, a rate of one in 90. That is worse than its 2024 figure and worse than every neighbor in either year. Buckeye’s 2023 rate was one in 169, better than the county average that year.
Combine both years and Goodyear is the only West Valley city on the wrong side of the county line, at one death per 108 crashes against Maricopa County’s one per 138.
Buckeye’s 2024 showing rests on seven deaths, a base small enough that a single collision moves it several places.
Goodyear is the pattern. Buckeye is a year that needs another year before anyone leans on it.
The Roads Doing the Damage
ADOT counts traffic separately from crashes, in an annual Average Annual Daily Traffic report that splits every highway into segments between interchanges. Read the I-10 segments west to east, from Buckeye toward Phoenix, and the shape of the West Valley’s growth is legible in a single column.
| I-10 segment | Vehicles per day (2024) | Truck share |
|---|---|---|
| SR-85 / Oglesby Rd to Miller Rd | 72,708 | 26% |
| Watson Rd to Verrado Way | 93,817 | 20% |
| Verrado Way to Jackrabbit Trail | 132,116 | 17% |
| Jackrabbit Trail to Loop 303 / Cotton Ln | 121,880 | 19% |
| Cotton Ln to PebbleCreek / Estrella | 184,209 | 18% |
| PebbleCreek to Bullard Ave | 205,654 | 16% |
| Bullard Ave to Litchfield Rd (Goodyear) | 239,334 | 13% |
| Litchfield Rd to Dysart Rd | 243,375 | — |

Volume more than triples over roughly 16 miles. A driver merging at State Route 85 joins 72,708 vehicles a day. The same driver passing Litchfield Road is in traffic of 243,375.
Nothing about the pavement announces the change, and a commuter covers the whole transition in about a quarter of an hour.
Lane-departure crashes, the ones where a vehicle leaves its travel lane, killed 771 people in Arizona in 2024 and injured 16,119. They are the characteristic failure of high speeds and long sight lines, which is what the western segments offer and the eastern ones do not.
ADOT sorts every crash into urban or rural. Arizona recorded 105,300 urban crashes and 781 deaths against 15,807 rural crashes and 447 deaths.
Rural collisions were 13 percent of the total and 36 percent of the fatalities. A rural crash killed someone once in every 35. An urban crash killed someone once in every 135.
West Valley corridors are being reclassified from the first category into the second while the roadbed underneath stays where the 1990s left it.
SR-85 Carries a Quarter of Its Traffic in Trucks

State Route 85 runs south out of Buckeye toward Gila Bend and takes the freight that has no business in Phoenix.
Its volume is modest, between 16,299 and 24,274 vehicles a day depending on the segment, roughly a tenth of I-10 through Goodyear. Its truck share runs between 21 and 32 percent.
| SR-85 segment | Vehicles per day | Trucks | Truck share |
|---|---|---|---|
| Komatke Rd to MC 85 | 16,299 | 5,201 | 31% |
| MC 85 to Baseline Rd | 22,136 | 5,566 | 25% |
| Baseline Rd to Southern Ave | 18,884 | 6,216 | 32% |
| Southern Ave to Broadway Rd | 24,274 | 5,285 | 21% |
| Broadway Rd to I-10 | 22,907 | 5,668 | 24% |

Most of those are combination rigs rather than delivery trucks. On I-10’s heaviest Goodyear segment, trucks are 13 percent of 239,334 vehicles. A Buckeye driver turning onto SR-85 is entering a traffic mix roughly twice as heavy as the interstate, on a road built to carry a fraction of the interstate’s volume.
Where a collision happens also decides who holds the paperwork afterward. A crash on the Goodyear stretch of I-10 is worked by the Department of Public Safety; a crash on a Goodyear surface street is worked by Goodyear police, and the two reports live in different systems. Sorting that out is the first practical task facing car accident attorneys in Arizona’s West Valley, before any question of fault gets raised.
Loop 303 and the Distribution Boom
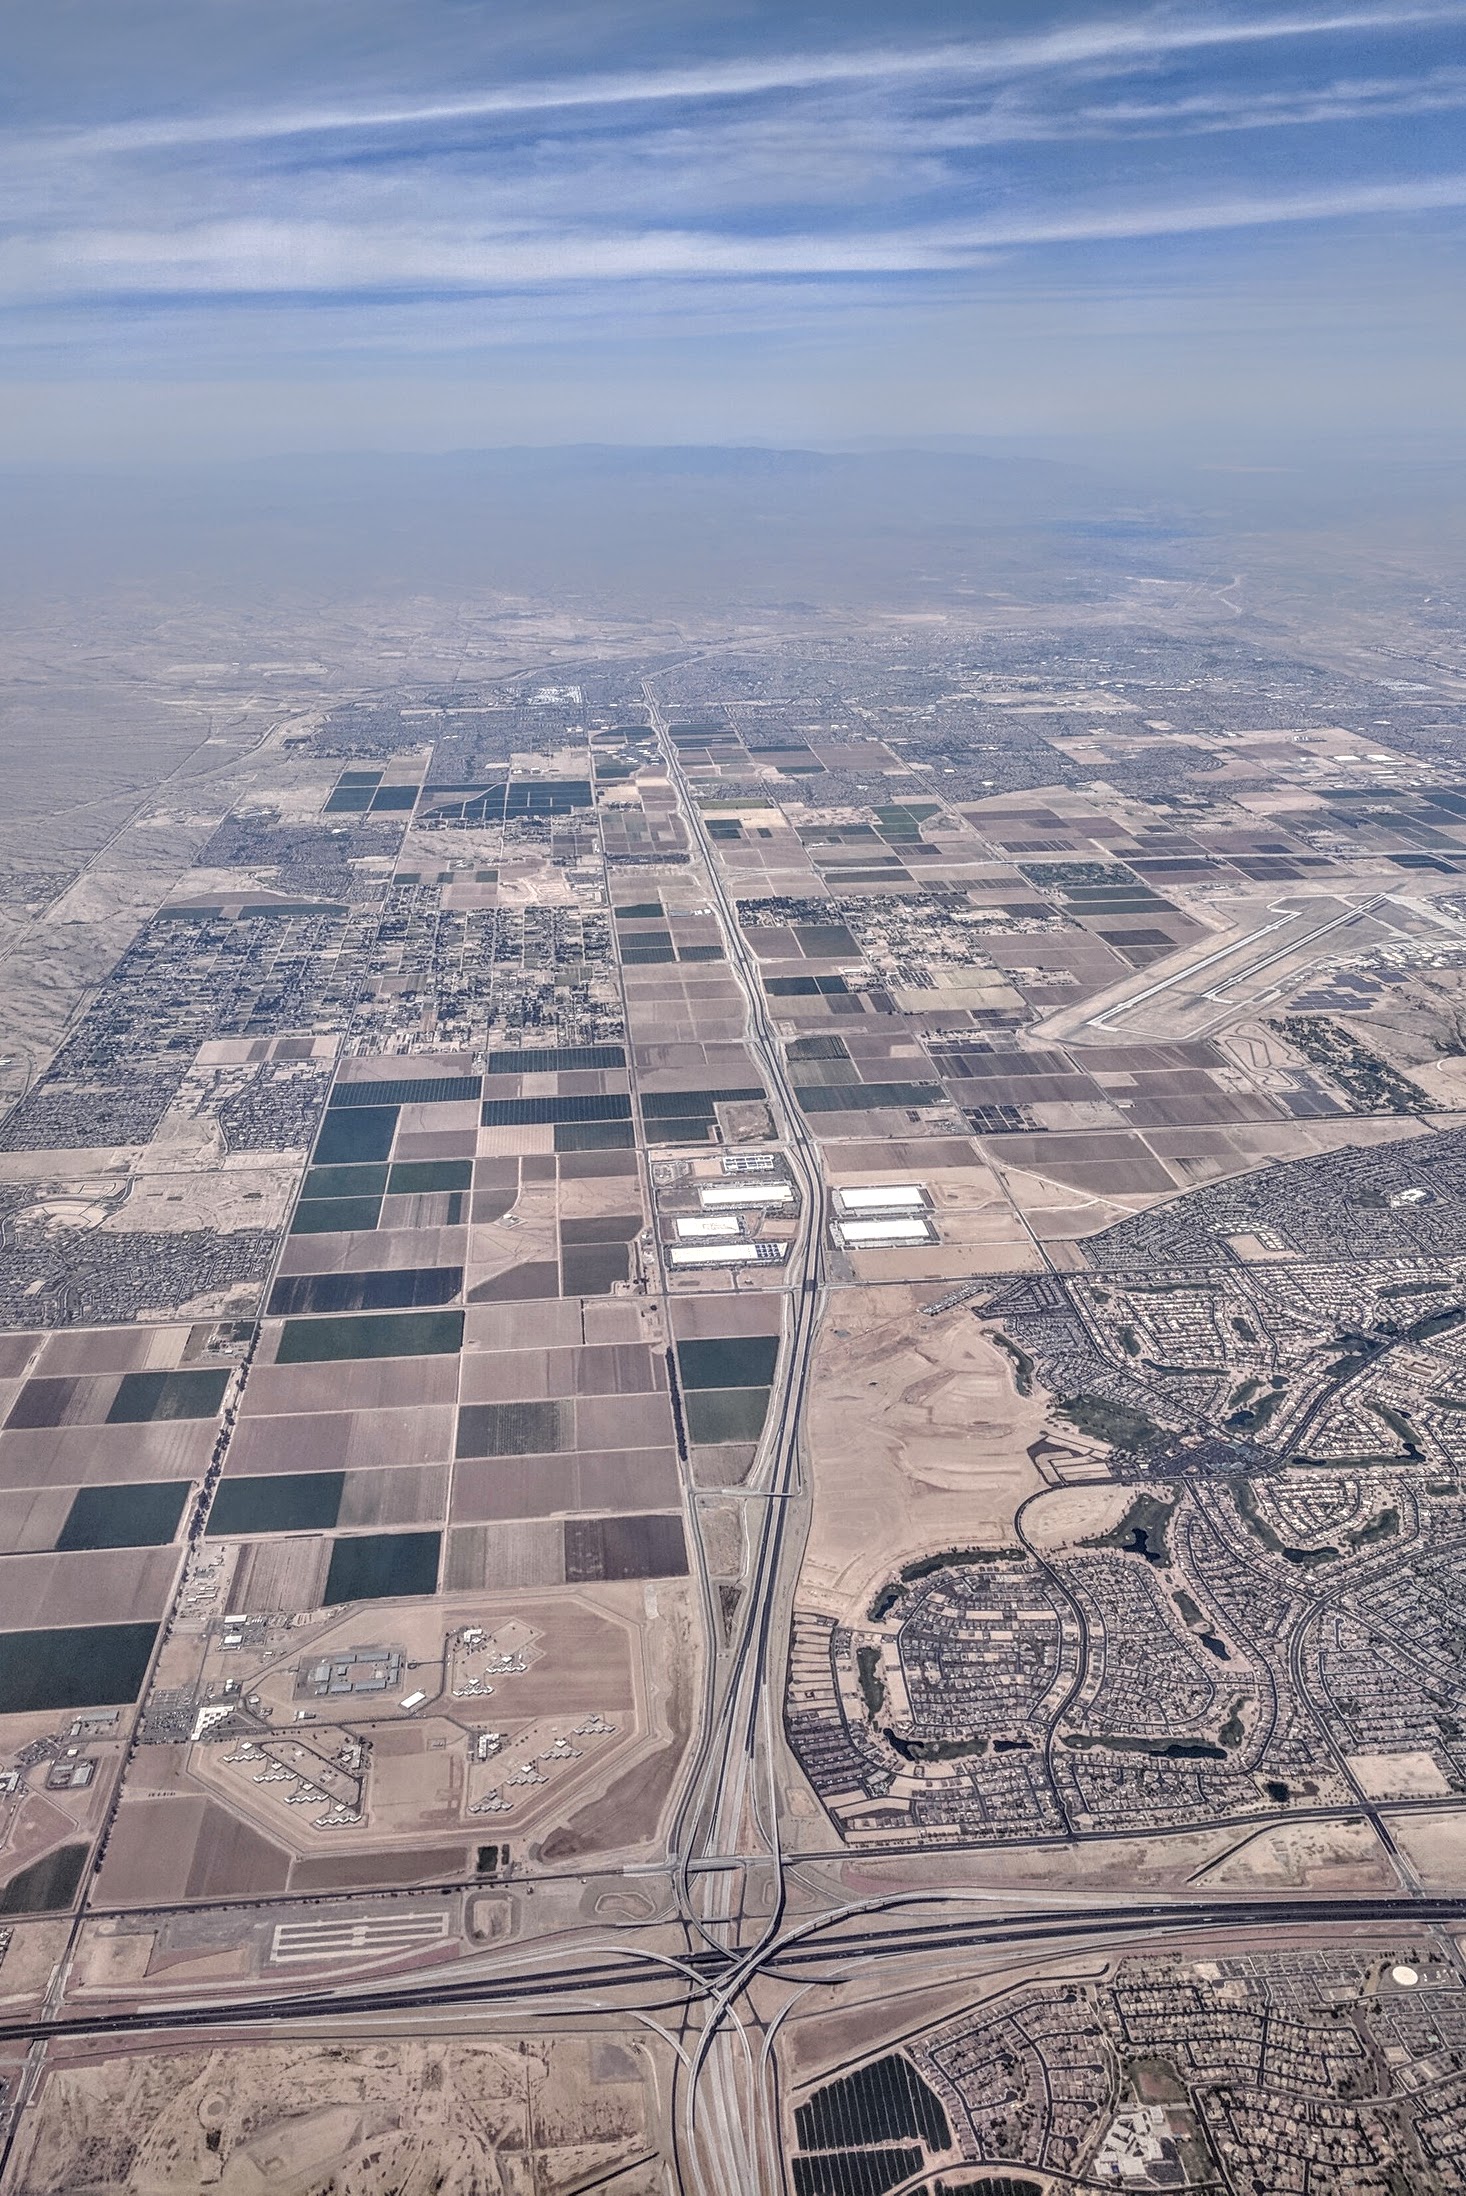
Loop 303 closes the triangle. The segment below Interstate 10, running from the SR-303 crossing to the I-10 interchange at Cotton Lane, carries 54,711 vehicles a day, 10,636 of them trucks.
That is a 19 percent share. North of I-10 it drops to 12 percent. Freight concentrates at the southern tip, where the warehouse floorplates went up.

Statewide, truck tractors with or without a semi-trailer were involved in 3,245 crashes in 2024, 1.374 percent of all vehicles in crashes. Of those 3,245, some 106 were fatal, 679 caused injuries, and 2,460 were property damage only. That works out to a fatal rate of 3.3 percent for crashes involving a truck tractor. Across all Arizona crashes, the fatal share was 0.9 percent.
The corridors do not account for everything. Crashes on Arizona’s state highway system killed 453 people in 2024, while crashes on local roads killed 775.
Highway collisions concentrate severity, and the majority of the state’s deaths still happen on ordinary streets, which is where most West Valley driving takes place.
Why Growth Changes the Risk
Farmland becomes subdivision faster than the road grid gets rebuilt, and the West Valley is running every version of that mismatch at once.
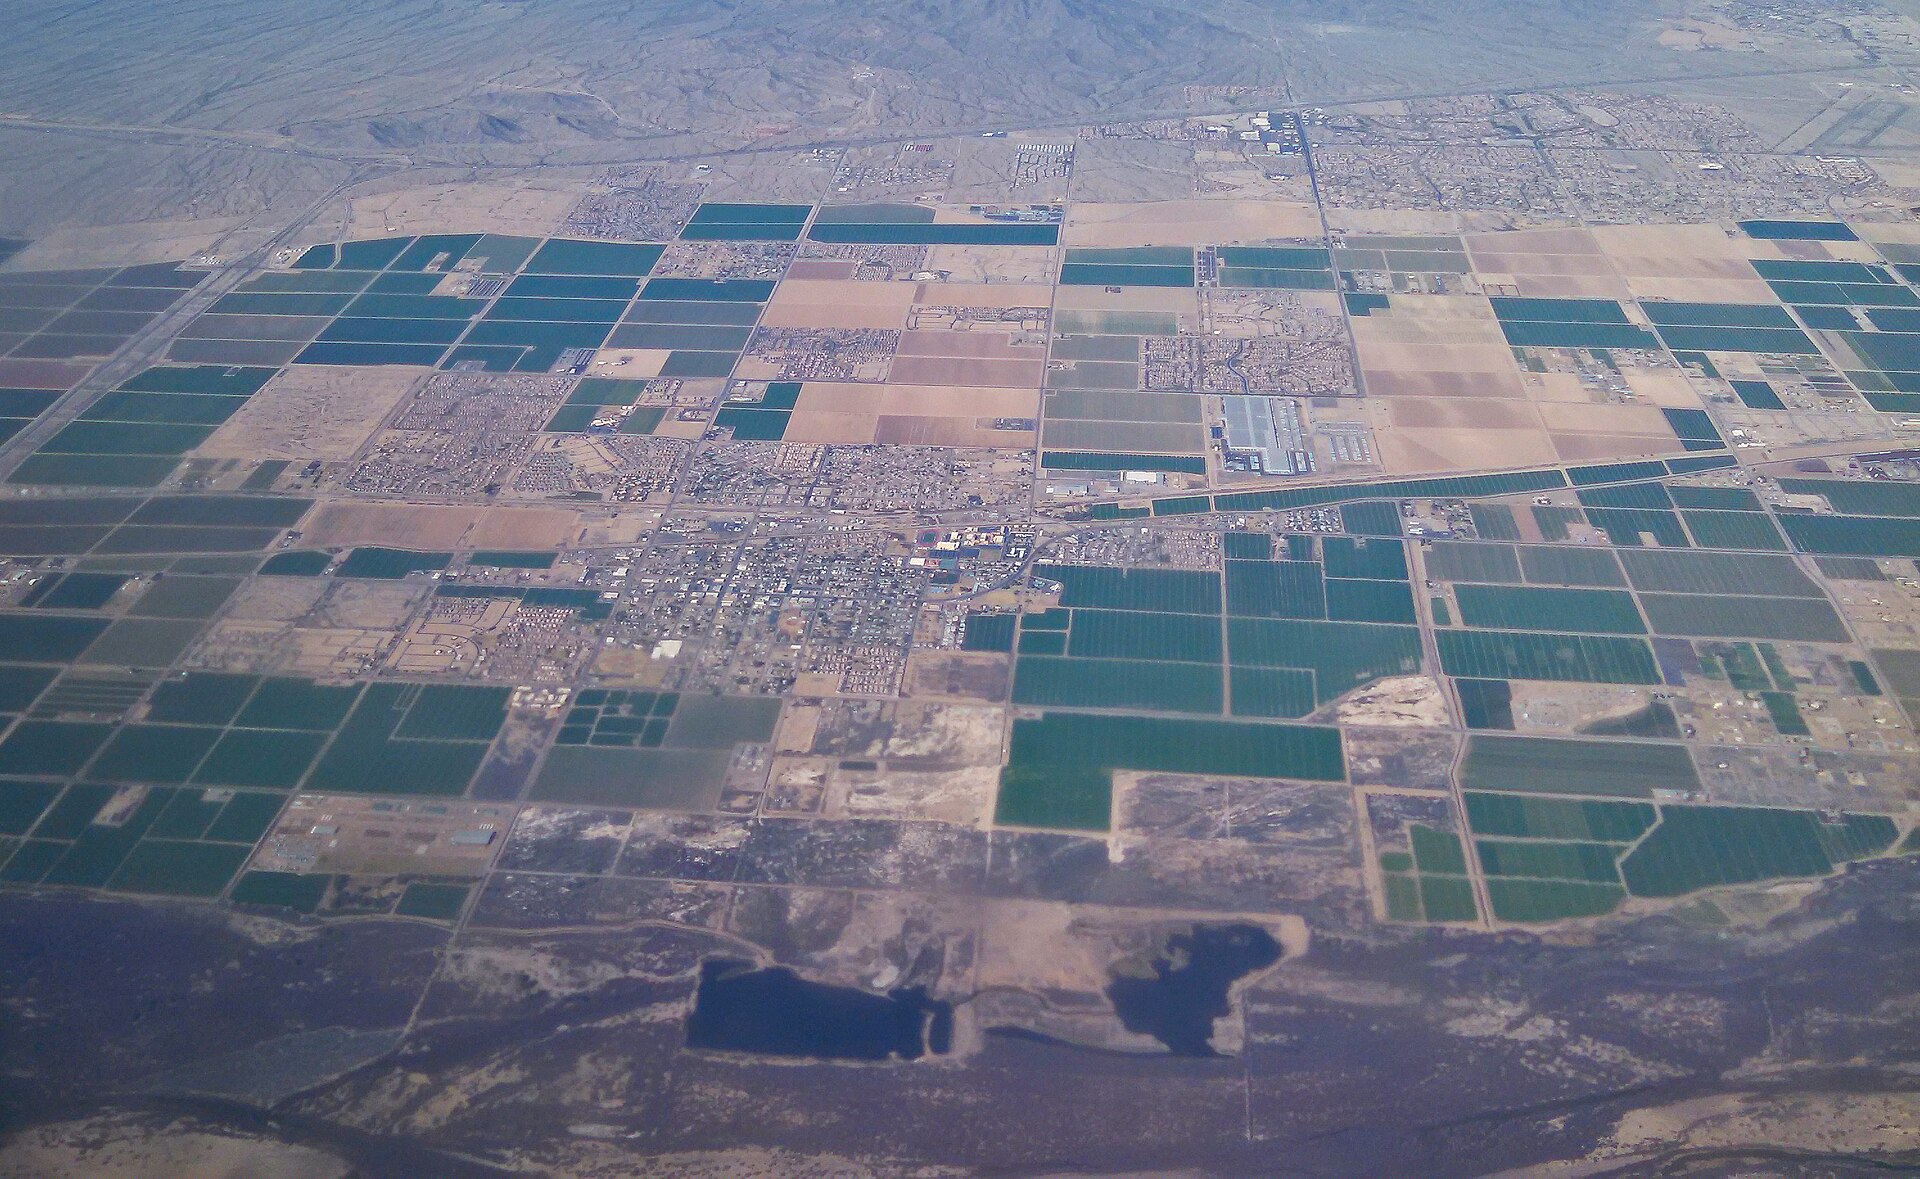
Roads laid out for agricultural traffic now absorb suburban volume. A two-lane county route designed for a few hundred trips a day does not become dangerous when it reaches a few thousand; it becomes dangerous when the drivers on it keep treating it like the old road. Wide lanes and unobstructed sight lines invite speed even where the posted limit has come down, because the visual cues that make drivers lift are the ones a rural alignment strips out.
Commutes are long here, and exposure scales with distance. A Buckeye resident working in central Phoenix drives considerably more miles per year than a Scottsdale resident working in Scottsdale, and every one of those miles is a chance.
New residents keep arriving into corridors they have not learned, and they mix with freight and agricultural equipment that has used those corridors for decades. The unfamiliar driver and the semi with a wide turning radius arrive at the same stop line with different expectations of what happens next.
Crashes Peak at 3 p.m. and Fatal Crashes at 6 p.m.
ADOT breaks crash timing out by hour, day, and month, and the West Valley’s evening commute runs through the worst window on the chart.

The 3 p.m. hour produced 10,377 crashes in 2024, more than any other hour of the day. The 6 p.m. hour produced 79 fatal crashes on 7,498 total collisions, also more than any other hour. Three hours separate the peak for damage from the peak for death. The afternoon peak is full of low-speed contact in heavy traffic. The evening peak has fewer crashes and worse ones.
Pedestrian collisions peak in that same 6 p.m. hour. Arizona counted 2,079 of them in 2024 and 263 pedestrian deaths.
Friday carried the heaviest load on both counts, 20,132 crashes and 199 fatal ones. October was the peak month for crashes overall; April for fatal ones.
Weekend crashes were roughly twice as lethal per collision as weekday crashes, one death per 75 against one per 130.
Speed-related crashes killed 417 people and injured 20,722. Alcohol was involved in 5,520 crashes and 347 deaths, with a peak hour of 2 a.m. Motorcycle crashes numbered 3,036 and took 219 rider and passenger lives.
What This Means for West Valley Drivers
One statewide number outranks every corridor-specific adjustment on this list. Arizona recorded 397 deaths among people using a safety device and 340 among people who were not. The restrained group also absorbed 44,149 injuries against 3,088 for the unrestrained.
Read as a share of everyone hurt or killed, roughly one unrestrained occupant in ten died. For those belted in, it was about one in a hundred.
What to Change on These Corridors
- Treat the I-10 volume change as a real transition. The gap that works at 72,000 vehicles a day does not work at 240,000. Following distance that felt generous near SR-85 is tailgating by Litchfield Road.
- Leave more room behind combination vehicles on SR-85 and Loop 303. FMCSA puts the stopping distance for a fully loaded 80,000-pound tractor-trailer at 65 mph at roughly 525 feet, against about 316 feet for a passenger car. That is an extra 200 feet, and on SR-85 you are sharing the road with one about a quarter of the time.
- Stay out of the blind spots. A tractor-trailer cannot see directly behind the trailer, along the right side for most of its length, or immediately ahead of the cab. Passing on the right and sitting in that zone is the common thread in a lot of truck collisions.
- Reconsider unprotected left turns on the big arterials. The wide multi-lane crossings that came with West Valley development put a long gap between you and the far curb, and oncoming speeds are hard to judge across six lanes. A right turn and a loop back costs a minute.
- Give the 6 p.m. hour extra attention. It is the deadliest hour on Arizona roads and the peak hour for pedestrian crashes, and it is exactly when the West Valley commute is heading home.
- Watch the winter sun angle. From late fall through winter the sun sits low and directly ahead of eastbound morning traffic and westbound evening traffic on I-10. A dirty windshield turns that into a wall.
What Happens After a West Valley Crash
Arizona runs more than one filing deadline, and the shortest of them attaches to the crashes most likely to happen on these corridors.
The general deadline for a personal injury lawsuit is two years from the date of injury, under A.R.S. § 12-542.
The Public-Entity Deadlines Are Much Shorter
If a claim runs against a city, a county, the state, ADOT, or a public employee, two separate clocks start at once:
- 180 days to serve a notice of claim under A.R.S. § 12-821.01. A claim not filed within 180 days of accrual is barred outright. The notice has to state a specific settlement figure and the facts supporting it.
- One year to file the lawsuit itself under A.R.S. § 12-821, not the usual two.
If the entity does not respond within 60 days, the claim is deemed denied under § 12-821.01(E). A road-design or signal-timing claim arising from a West Valley corridor is a public-entity claim.
Arizona applies pure comparative negligence under A.R.S. § 12-2505. A claimant’s recovery is reduced by their own share of fault but is not eliminated by it. Most states bar recovery once a plaintiff passes 50 percent responsibility; Arizona does not, so a driver found 70 percent to blame can still collect 30 percent of their damages. The statute withholds that protection from anyone who intentionally, willfully, or wantonly caused the injury.
Which agency responded determines where the report lives. The Department of Public Safety works collisions on I-10, SR-85, and Loop 303. City streets in Goodyear, Buckeye, Avondale, or Surprise go to that city’s police department.
Requesting the wrong one wastes weeks.
What holds up later is what gets preserved early: the crash report number, photographs of vehicle positions and road conditions before anything is moved, contact details for witnesses who will otherwise be unreachable, and medical records that establish a continuous treatment history rather than a gap someone can argue about.
The West Valley’s crash problem sits on its corridors rather than across its cities. Surprise and Avondale both came in safer per crash than the Maricopa County average. The two cities whose grids feed I-10 and SR-85 lost someone roughly every 135 crashes, while the two that mostly move traffic on surface streets lost someone every 210.
Road volume tripled across 16 miles of I-10 while the truck share on the parallel state route held near a quarter. Neither of those numbers is going down. The corridors will keep carrying more of both until the road grid catches up with the rooftops, and the driving that happens on them in the meantime is the driving that shows up in the next report.
Frequently Asked Questions
How many crashes were there in Arizona in 2024?
ADOT recorded 121,107 crashes statewide in 2024, resulting in 1,228 deaths and 54,426 injuries. That was down from 123,256 crashes and 1,308 deaths in 2023, a 1.74 percent drop in crashes and a 6.12 percent drop in fatalities.
Which West Valley city had the most traffic deaths in 2024?
Goodyear, with 14. Surprise had 10, Avondale 9, Buckeye 7, and Litchfield Park 1. Goodyear reached that total on 1,869 crashes, fewer than Surprise’s 2,110, which is why its per-crash fatality rate is the outlier of the group.
How much traffic does I-10 carry through Goodyear?
ADOT’s 2024 traffic counts put the segment between Litchfield Road and Dysart Road at 243,375 vehicles per day, the heaviest stretch in the West Valley. At the western end near the SR-85 junction the same interstate carries 72,708.
Is SR-85 more dangerous than I-10?
The two roads carry different risks rather than different amounts of it. SR-85 moves about a tenth of I-10’s Goodyear volume, but between 21 and 32 percent of its traffic is trucks, against 13 percent on I-10’s busiest Goodyear segment. Statewide, crashes involving a truck tractor were fatal 3.3 percent of the time against 0.9 percent for all crashes.
What time of day are crashes most likely in Arizona?
The 3 p.m. to 4 p.m. hour produces the most crashes, 10,377 in 2024. The 6 p.m. to 7 p.m. hour produces the most fatal crashes, 79. Friday is the peak day for both, and October is the peak month for crashes overall.
Why are rural crashes deadlier than urban ones?
Speed and response time. Arizona recorded 15,807 rural crashes and 447 deaths in 2024, against 105,300 urban crashes and 781 deaths. That works out to one death per 35 rural crashes and one per 135 urban ones. Higher impact speeds and longer emergency response distances account for most of the gap.
How long do I have to file a car accident claim in Arizona?
Two years from the date of injury for most personal injury suits, under A.R.S. § 12-542. Claims against a public entity are different: a notice of claim must be served within 180 days under § 12-821.01, and the lawsuit must be filed within one year under § 12-821.
What is pure comparative negligence?
Under A.R.S. § 12-2505, an injured party’s recovery is reduced by their own percentage of fault but not barred by it. Someone found 60 percent at fault can still recover 40 percent of their damages. Most states cut off recovery at 50 or 51 percent fault; Arizona does not.
Who investigates a crash on I-10 versus a city street?
The Arizona Department of Public Safety handles collisions on interstates and state routes including I-10, SR-85, and Loop 303. Municipal police departments handle crashes on city surface streets. The reports are held separately, so the request has to go to the agency that responded.
What should I do at the scene of a West Valley crash?
Get the crash report number and the responding agency, photograph vehicle positions and road conditions before anything moves, and collect contact information from witnesses while they are still present. Seek medical evaluation promptly; a continuous treatment record is harder to dispute than one with a gap in it.
How many people were killed in lane-departure crashes in Arizona?
771 in 2024, with another 16,119 injured. Lane-departure crashes are the ones in which a vehicle leaves its travel lane, and they are characteristic of higher-speed roads with long sight lines.
Did Arizona traffic deaths go up or down in 2024?
Down. Fatalities fell from 1,308 in 2023 to 1,228 in 2024, a 6.12 percent decrease. Alcohol-related fatalities dropped from 358 to 347, pedestrian deaths from 273 to 263, and motorcycle rider and passenger deaths from 262 to 219.
Crash data from the Arizona Department of Transportation 2024 Motor Vehicle Crash Facts (full report, PDF). Traffic volumes and truck shares from ADOT’s 2024 Average Annual Daily Traffic reports for interstates and state routes.

Matthew Wilde
Matthew Wilde is an automotive journalist with experience contributing to leading publications. He focuses on delivering clear, well-researched analysis of automotive industry news and vehicles. Growing up surrounded by a variety of cars, Matthew developed a strong foundation in automotive technology and design. His work emphasizes accuracy and depth, aimed at informing both enthusiasts and industry professionals with straightforward, precise reporting.
https://theweeklydriver.com/